Sugar cravings, afternoon crashes, stubborn weight
The insulin resistance connection
Sounds familiar ?
Even if it can seem normal, these needs to be looked at
Family history + lifestyle habits are creating metabolic risk. I've watched family members struggle with diabetes, and now I'm concerned. I feel more fatigued, cuts healing slower.
Signals we commonly see when measuring
Your pattern, at a glance
Resting heart rate 78 bpm (elevated) · Average 3,200 steps daily
Family history of type 2 diabetes · Low daily movement
HOMA-IR ↑ · HbA1c ↑ · Glucose ↑ · Triglycerides ↑ · Liver enzymes ↑

How it works
Measure your body systems
Through a comprehensive blood draw in one of our partner labs, we measure 60+ to 110+ biomarkers across body systems and reveal exactly where you stand for each
Get personalized actions
Your biomarkers unlock a personalized protocol with evidence-based actions tailored to your exact health data for measurable outcomes

Improve and re-test
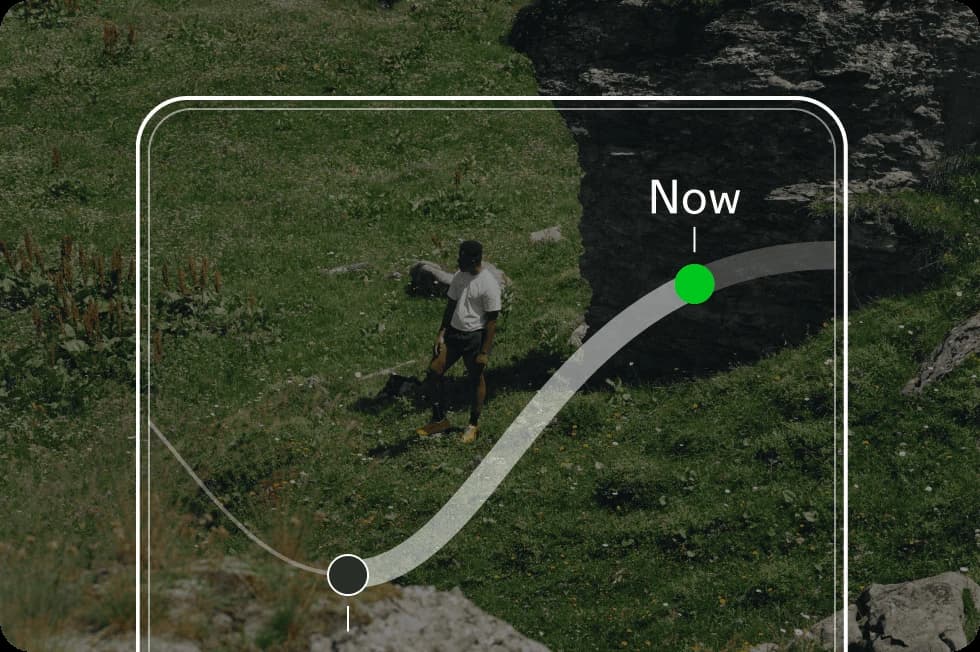
Track then retest within 3-6 months to validate your progress, see which actions worked, and continuously optimize your health for better healthspan
Whats happening biologically
Genetics loads the gun, but lifestyle pulls the trigger. Your family history means your baseline insulin sensitivity may be lower, but sitting most days and averaging minimal steps means your muscles aren't helping clear glucose from your blood. This creates a metabolic trajectory that's shifting quietly, before symptoms become impossible to ignore.
HOMA-IR: Your cellular efficiency score
HOMA-IR is calculated from your fasting glucose and fasting insulin. It reveals how responsive your cells are to insulin's signal. Think of it as a communication efficiency score between your pancreas and your cells. Higher scores mean your pancreas must shout louder to get the same response. It's like turning up the volume on a conversation because the other person isn't listening well anymore.
When HOMA-IR rises, it quantifies the decline in cellular responsiveness. Your pancreas is producing more insulin to achieve the same glucose control. This compensation works now. But it creates metabolic stress that compounds over time, like pressing harder on the gas pedal to maintain the same speed when your engine is struggling. Eventually, something gives.
Key insight: HOMA-IR reveals your trajectory, not just your current snapshot. Rising scores show cellular resistance is developing, even when individual glucose readings look acceptable. This is your body's early warning system telling you the margin for error is narrowing.
Bottom line: Blood sugar health shows how insulin signaling, cellular glucose uptake, liver function, and muscle activity work together. At Lucis, we measure HOMA-IR, HbA1c, glucose, triglycerides, and liver enzymes. Not just whether you're in range, but whether your metabolic trajectory is moving toward flexibility or rigidity.